See NordIQ in Action
Real screenshots from our production dashboard
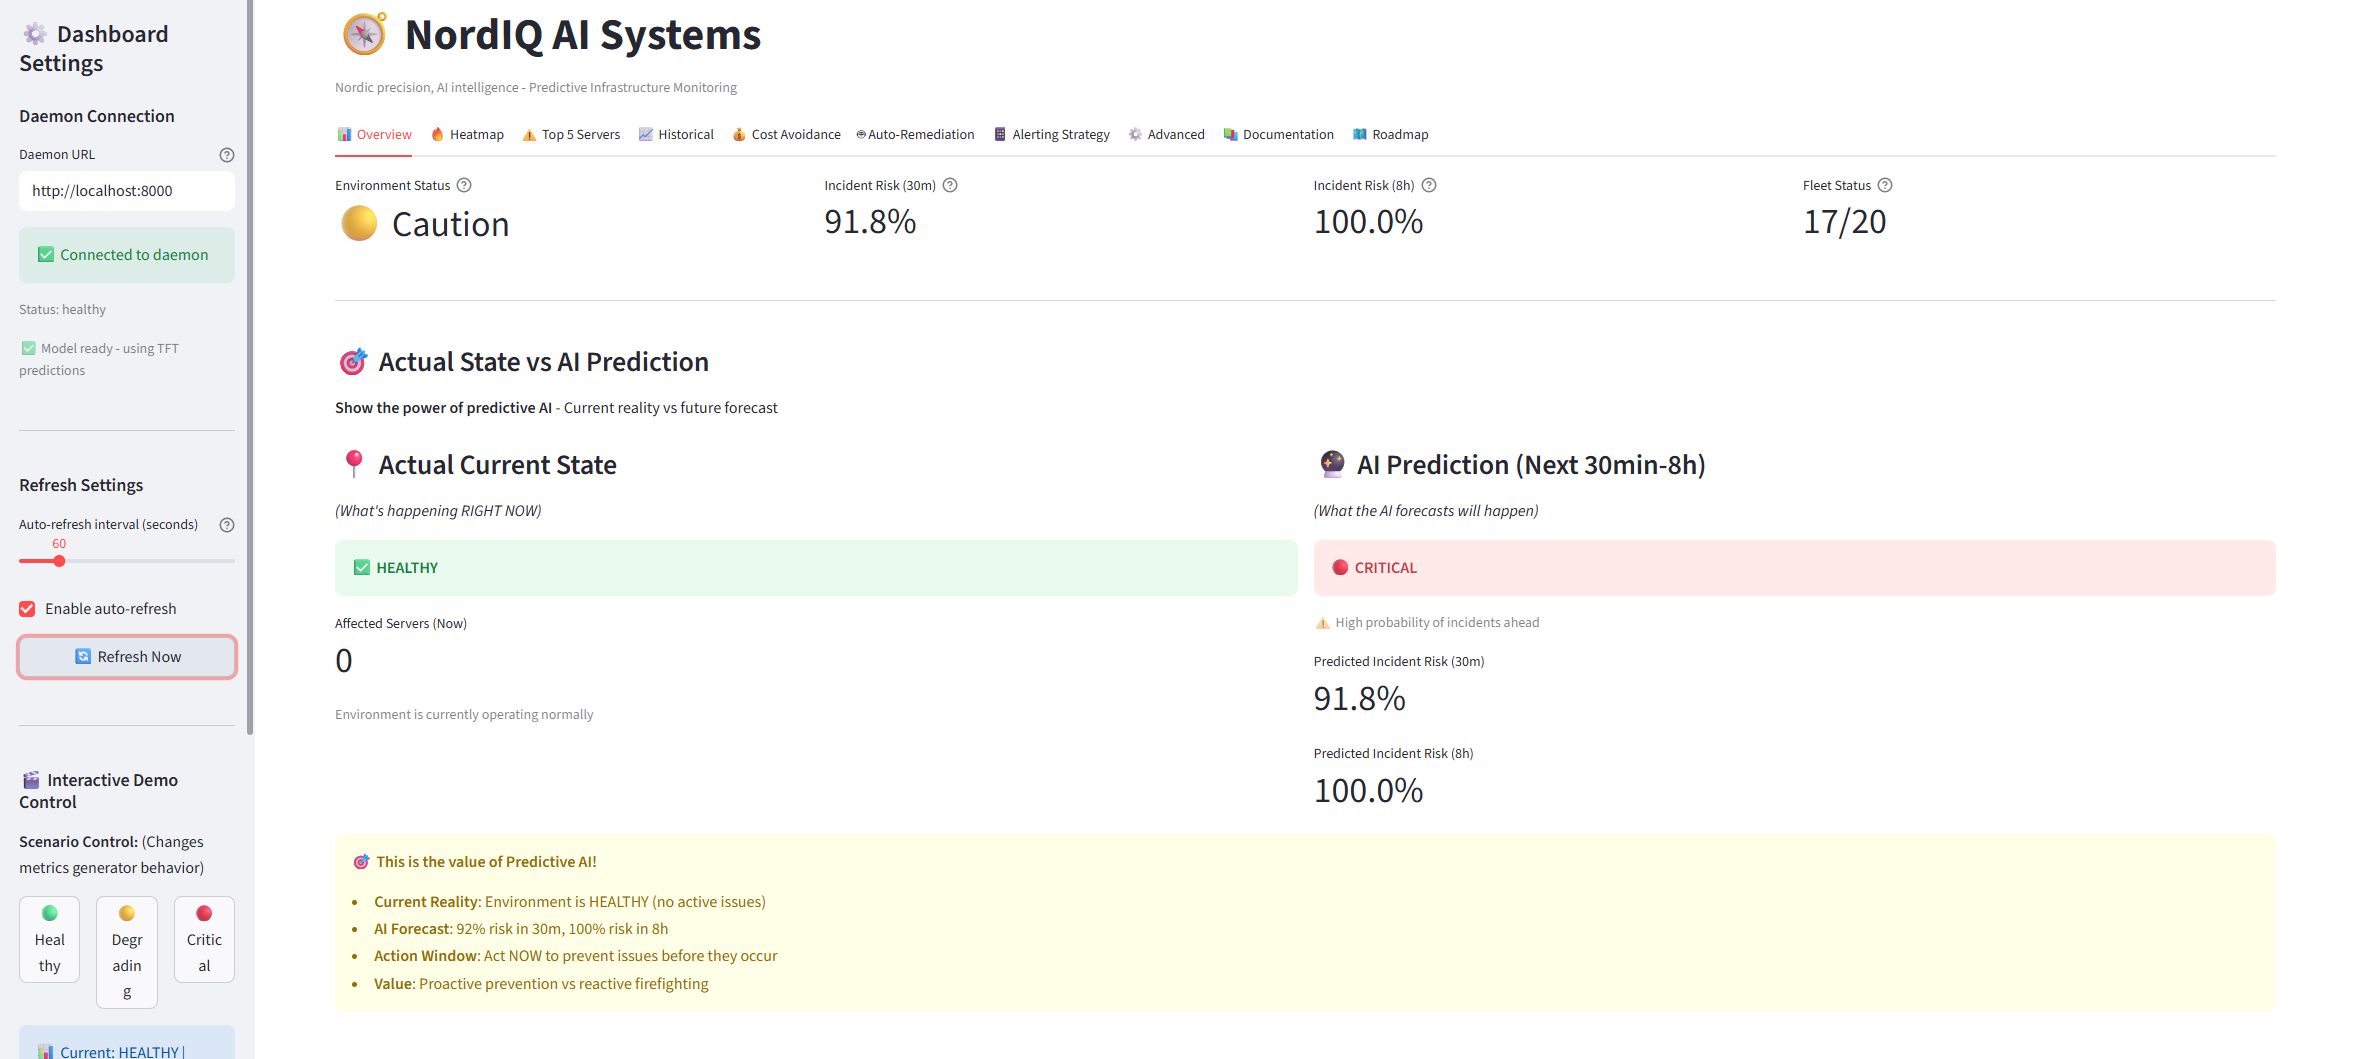
Fleet Overview - Real-time monitoring with actual vs predicted state comparison
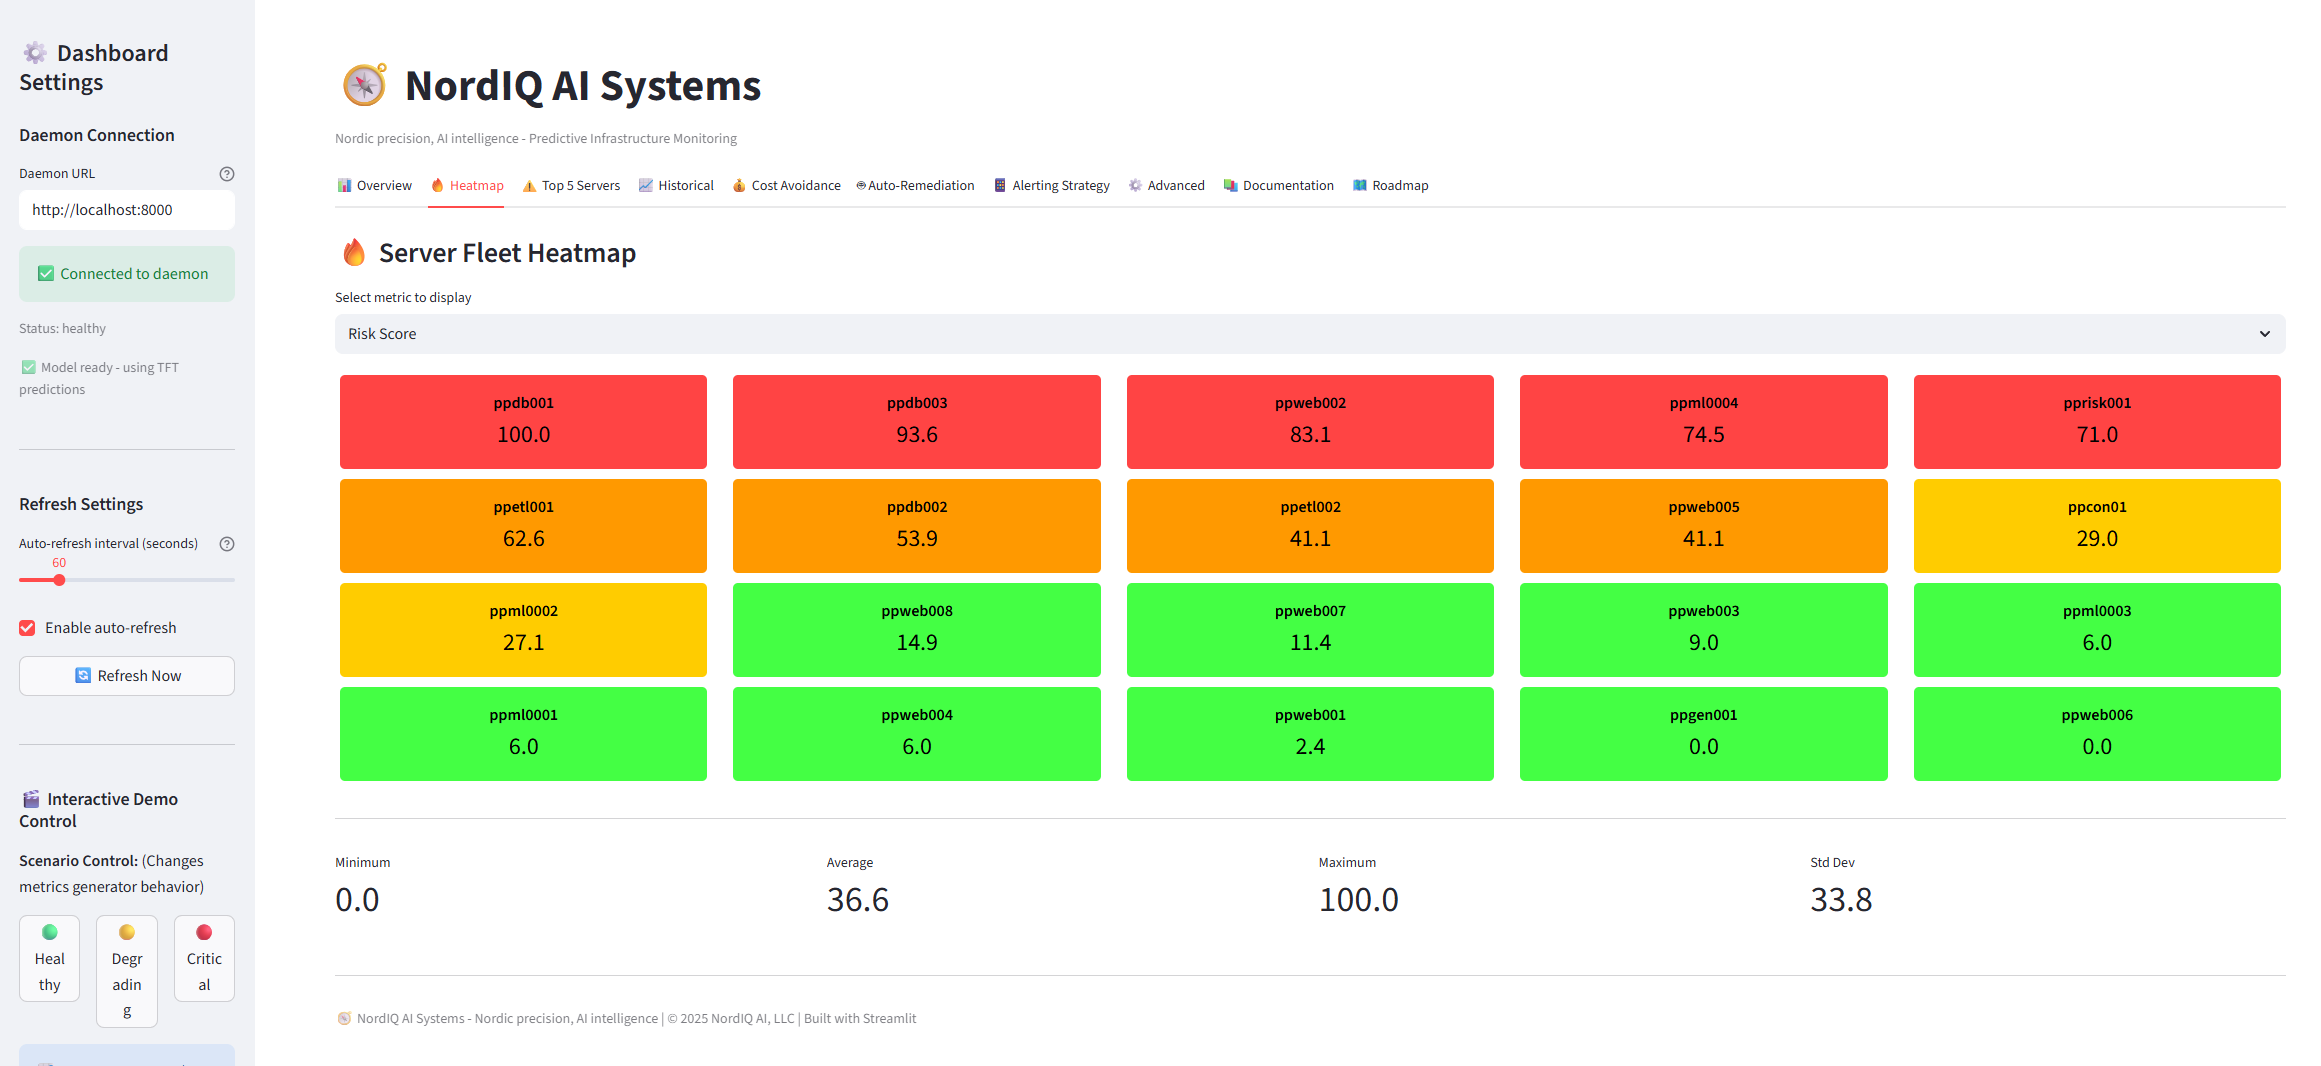
Risk Heatmap - Visual fleet health at a glance
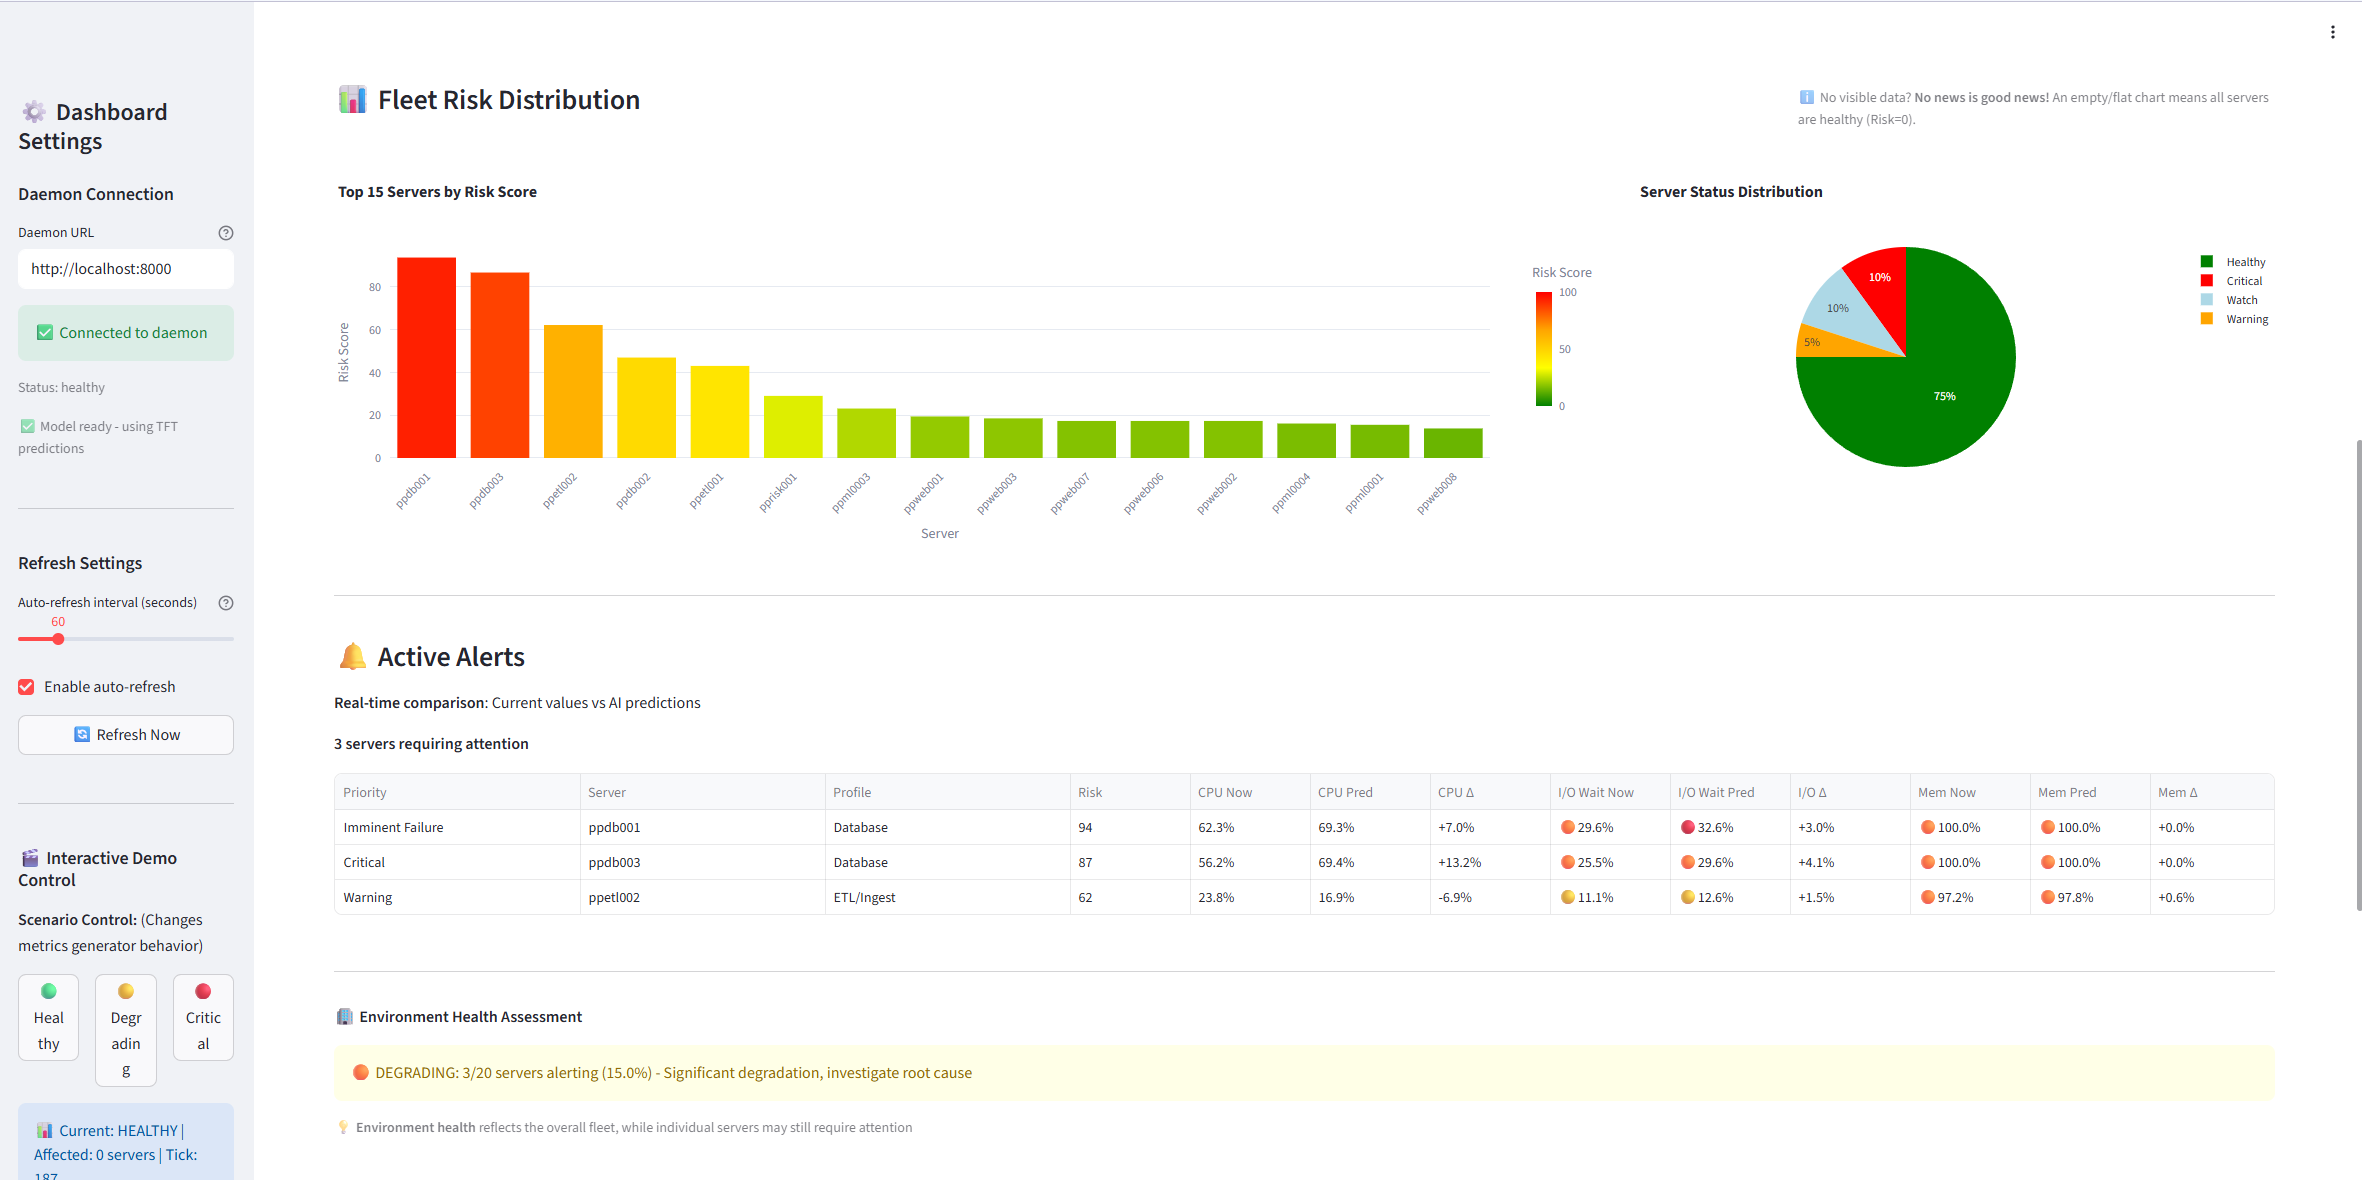
Top Risks - Focus on servers that need attention now
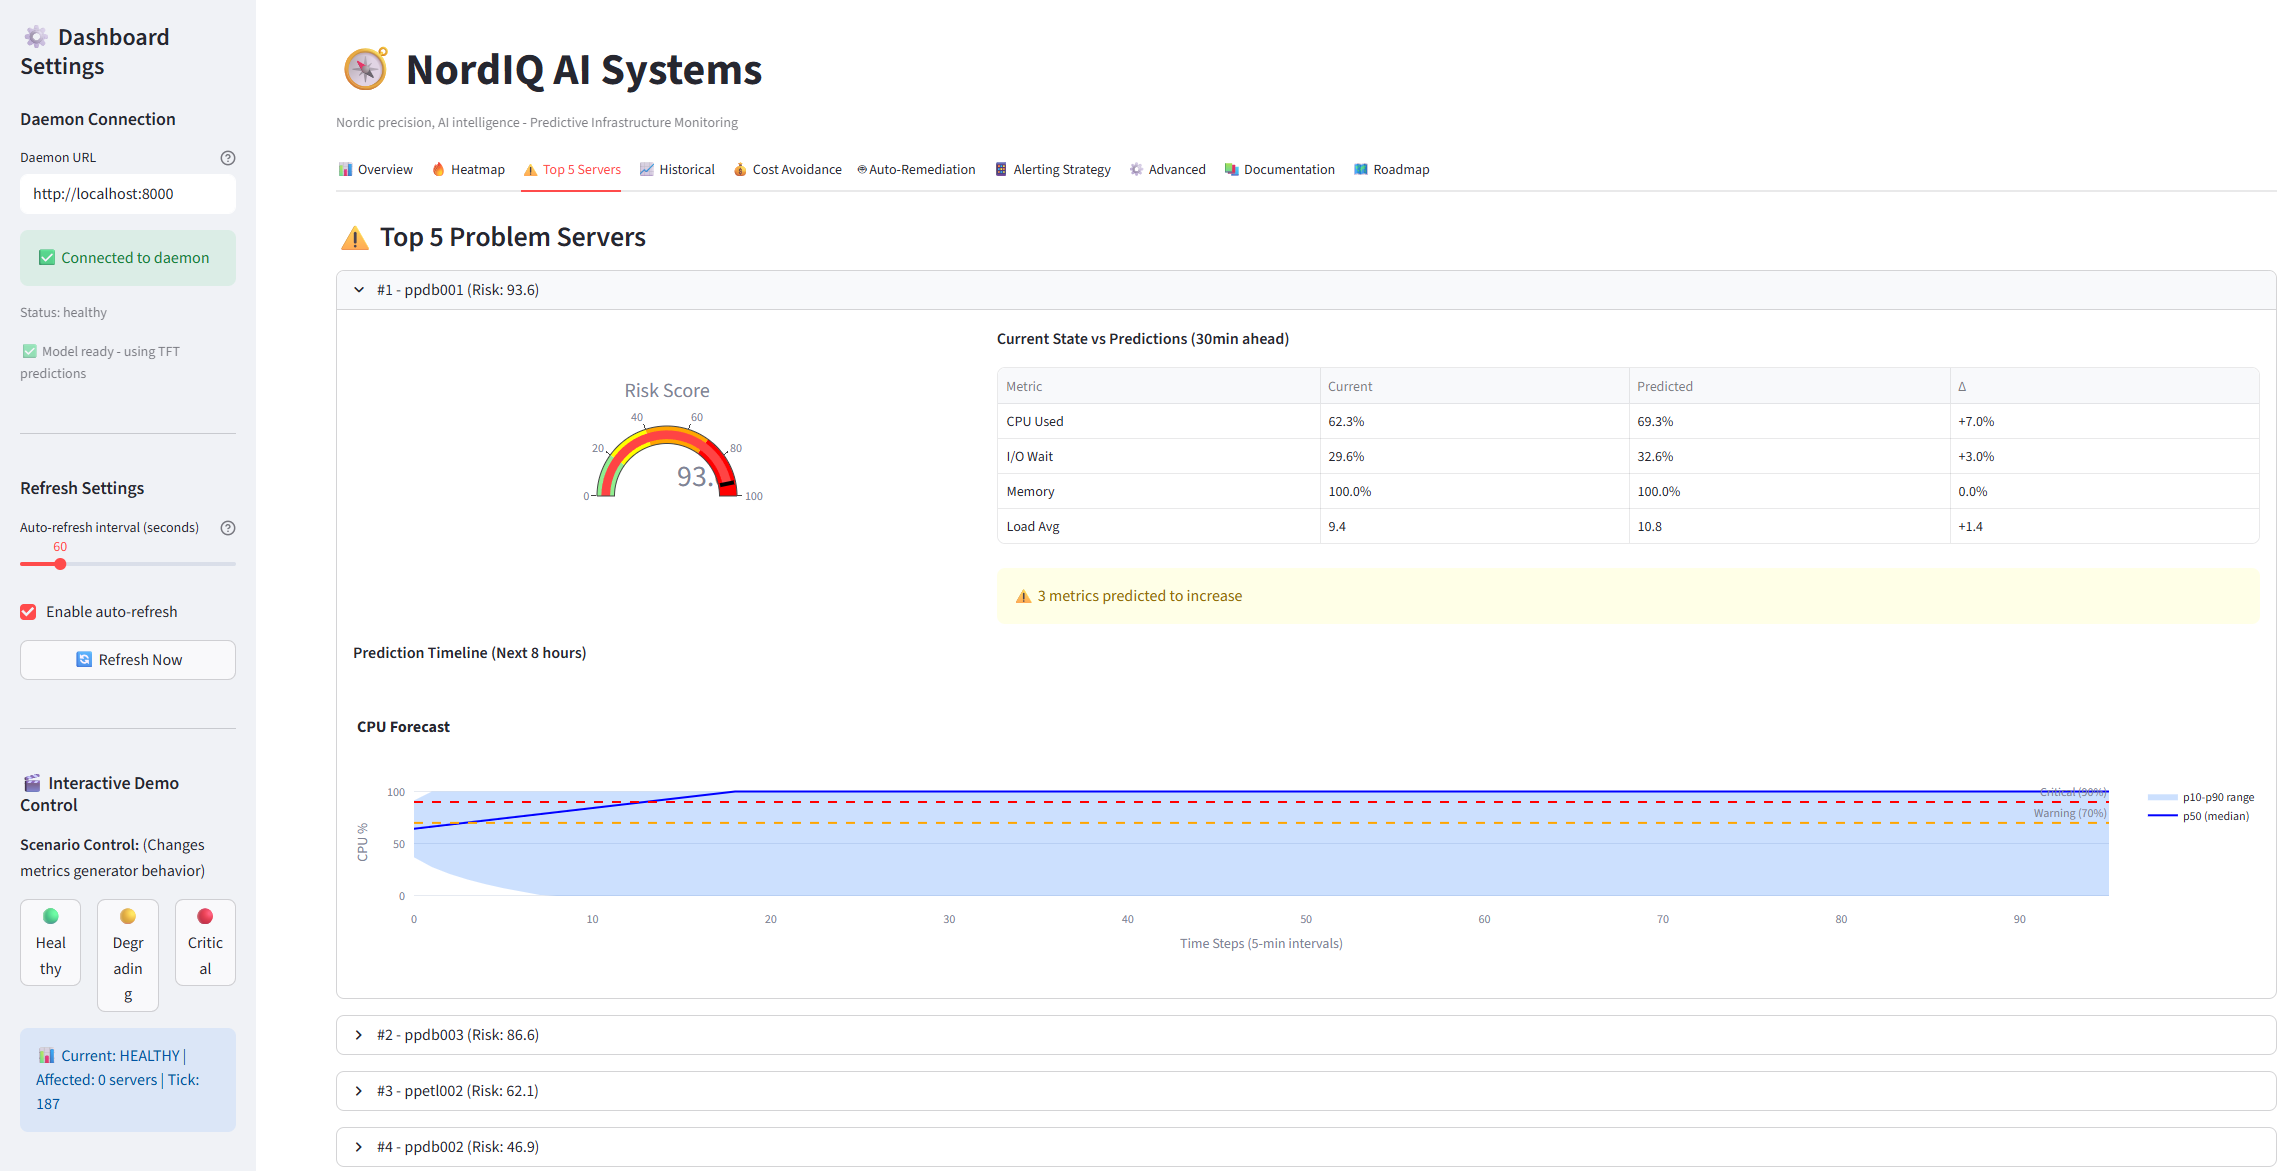
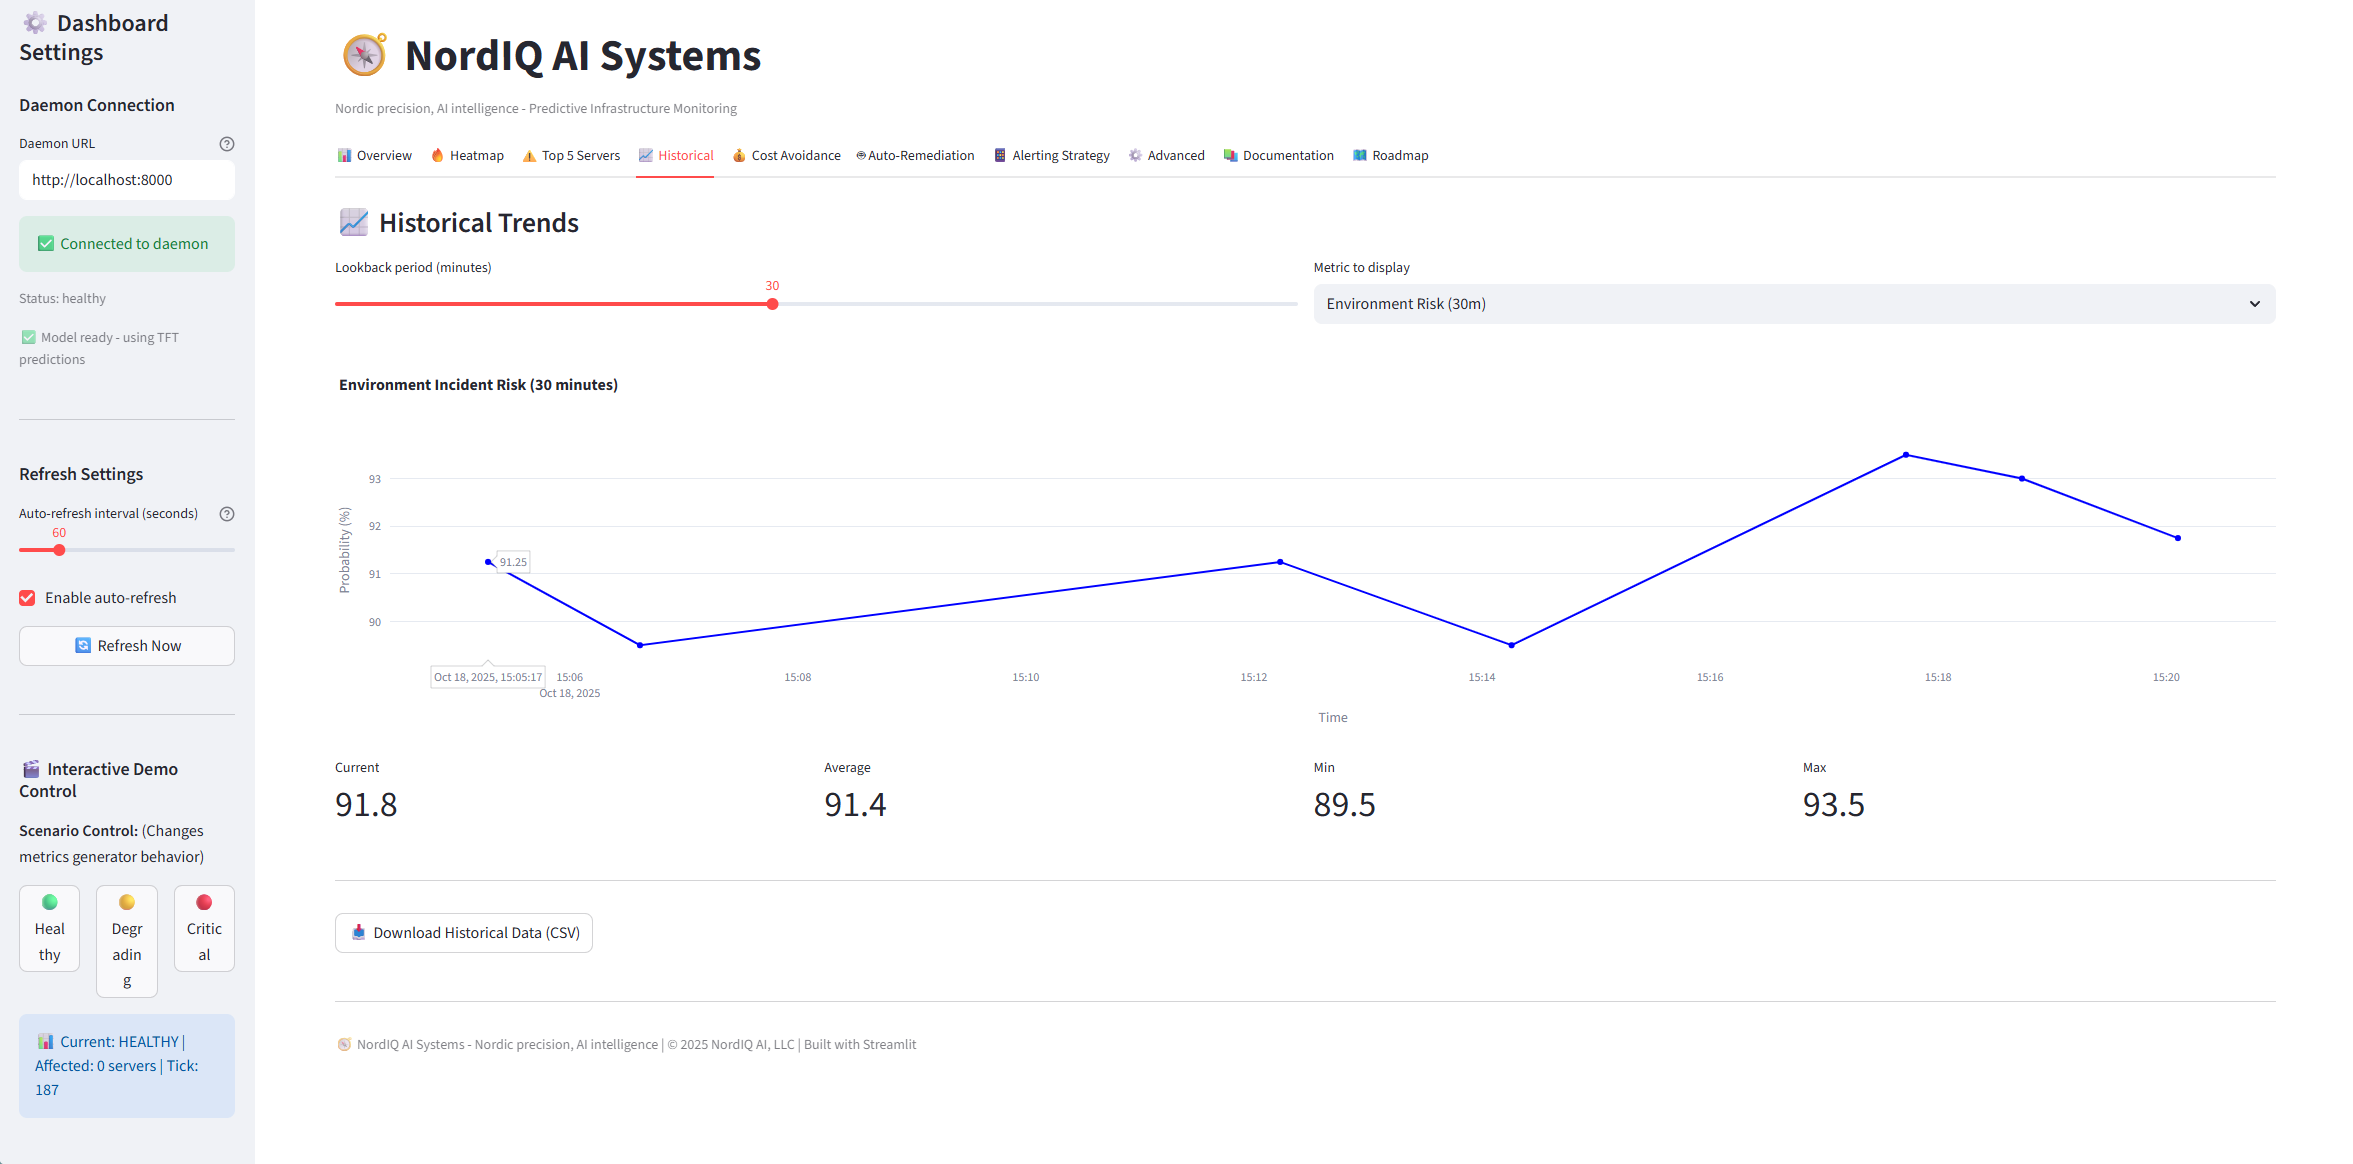
Historical Trends - 8-hour prediction horizon with confidence intervals
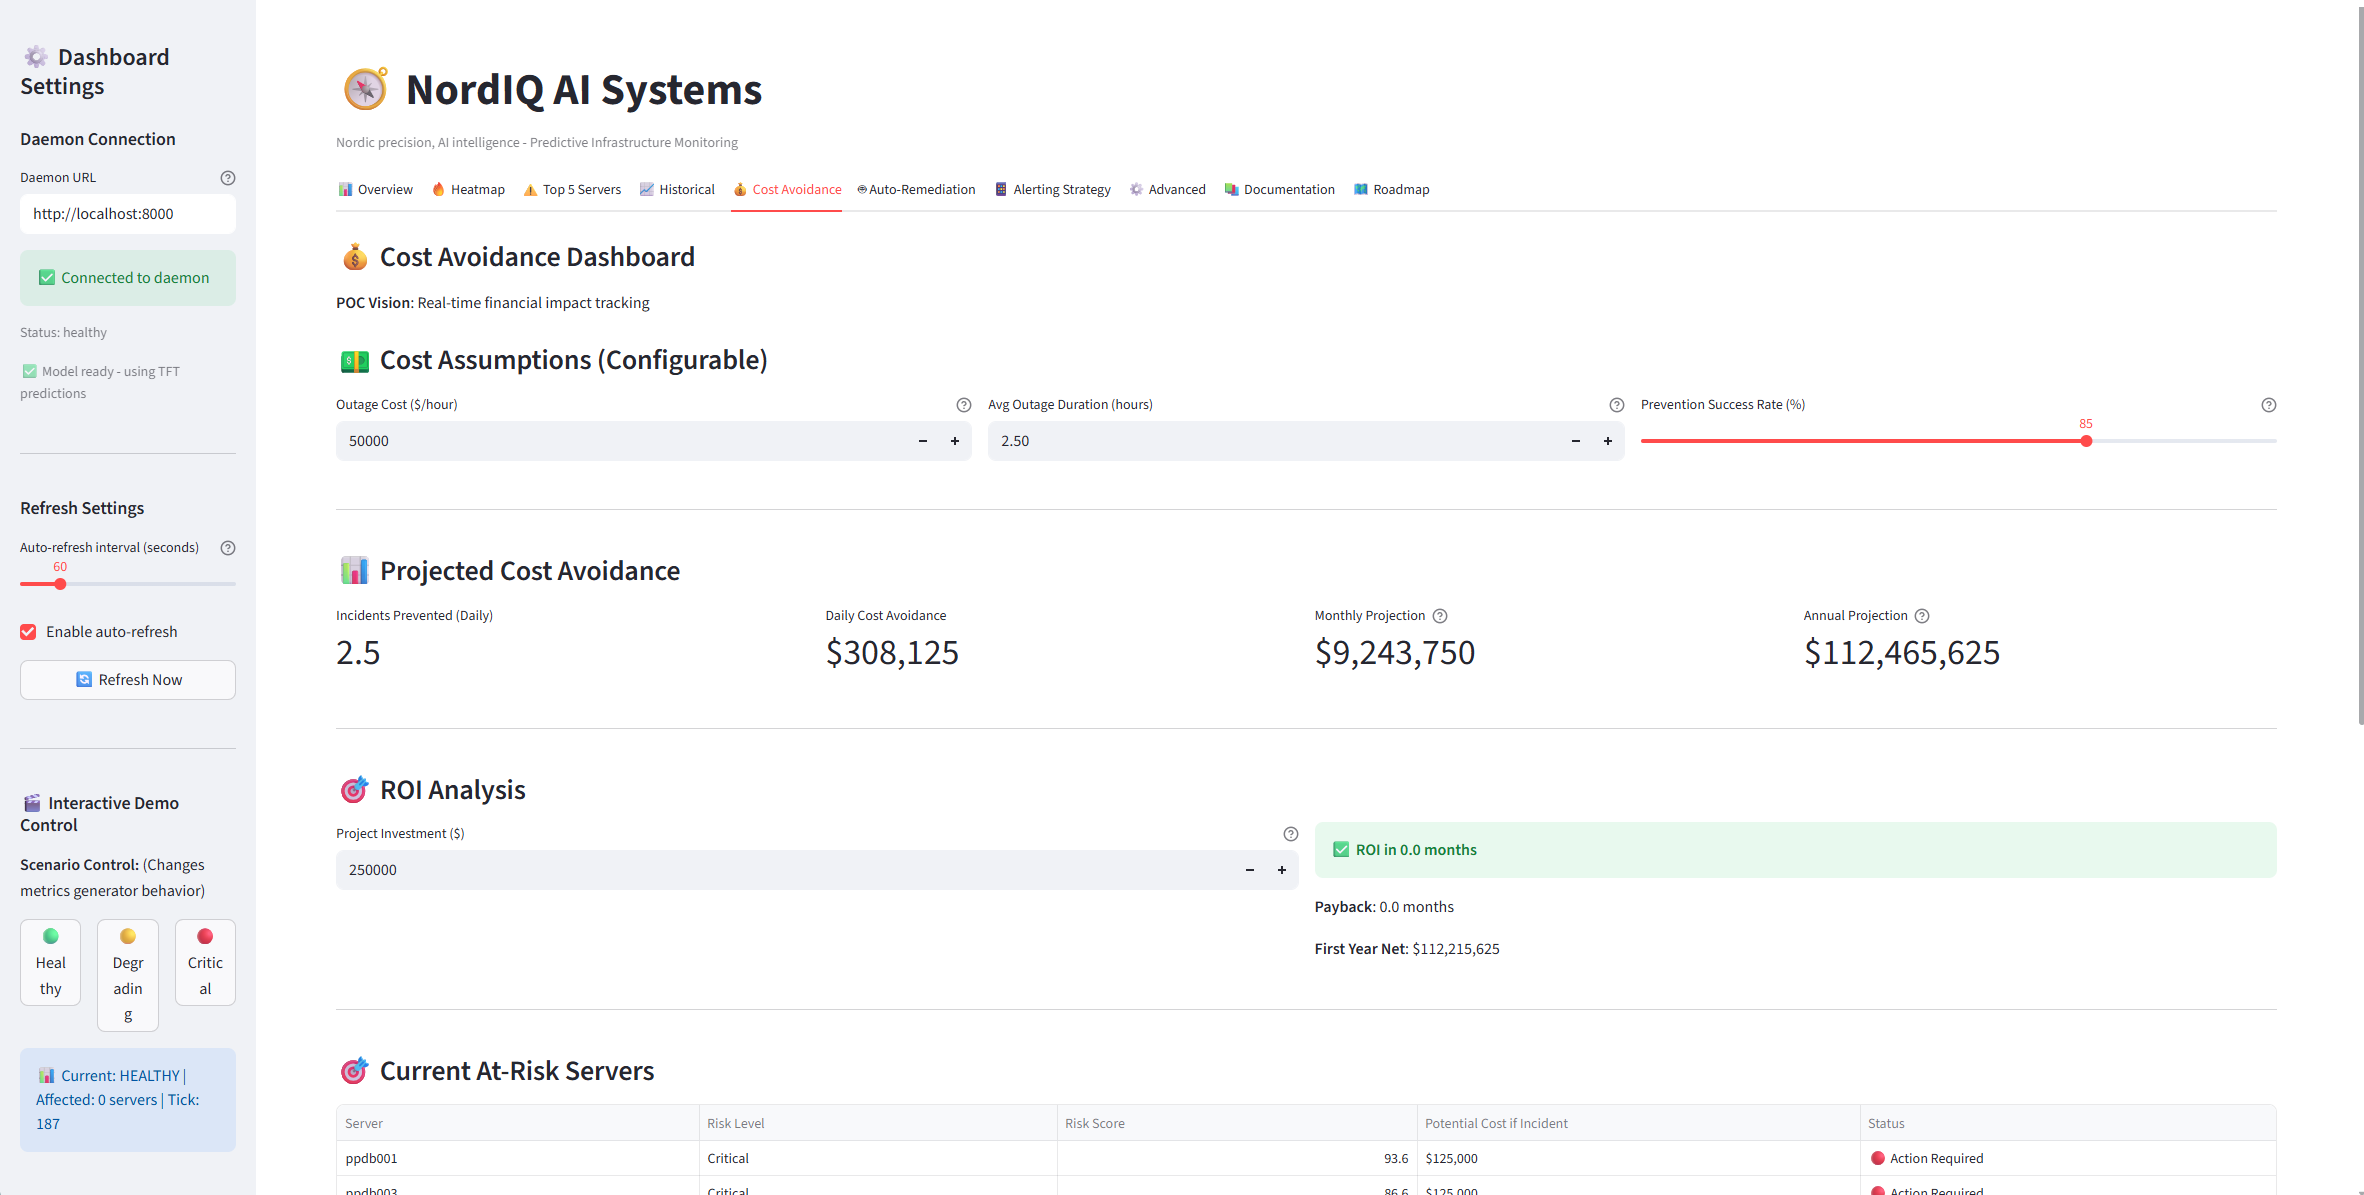
Cost Avoidance - Quantify the ROI of prevented outages
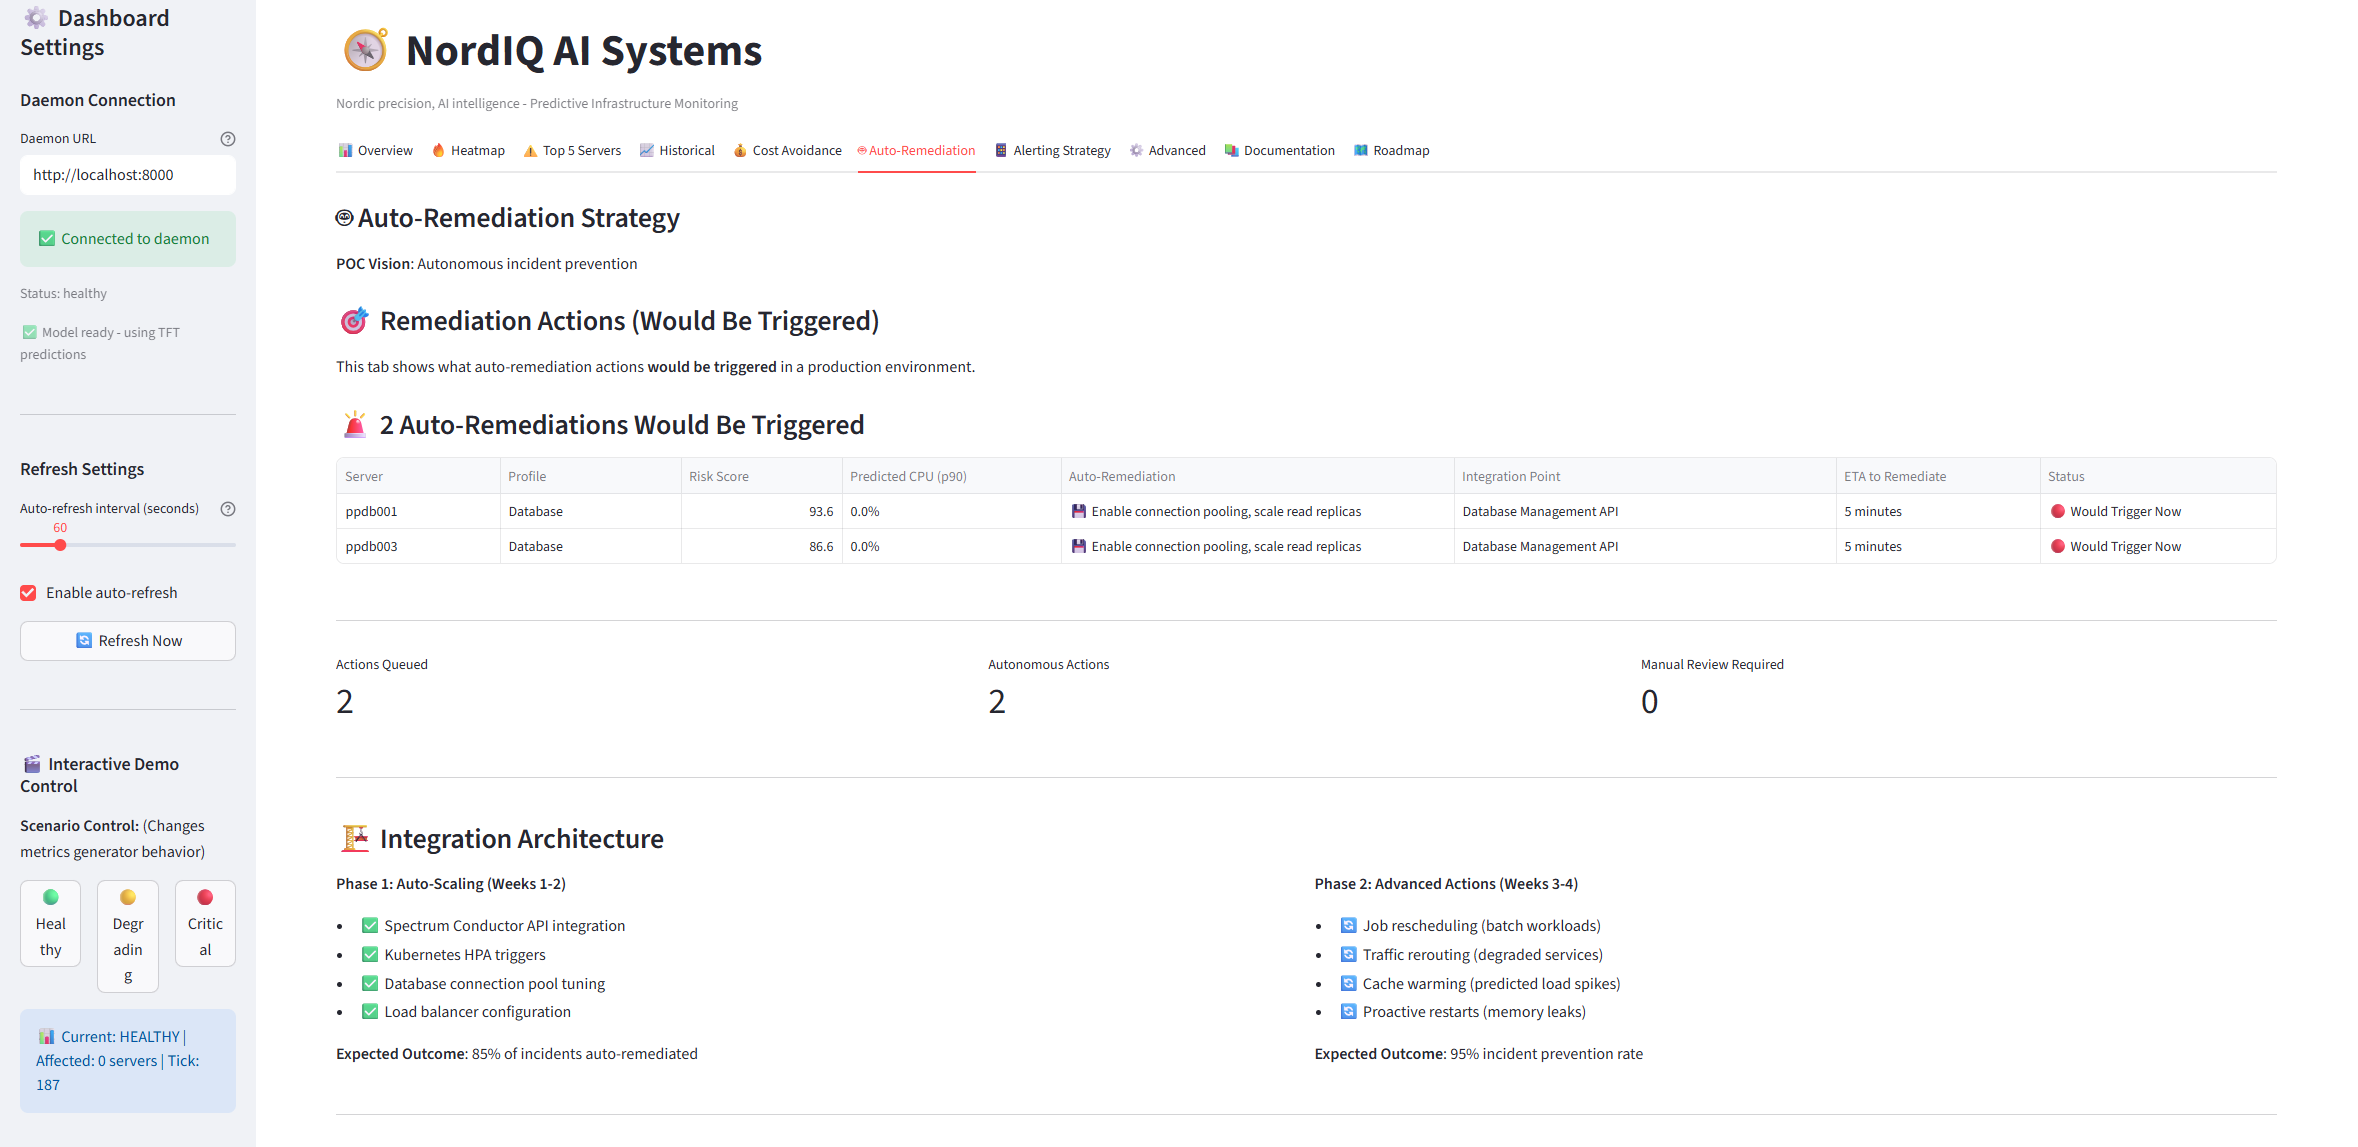
Auto-Remediation - Automated response playbooks
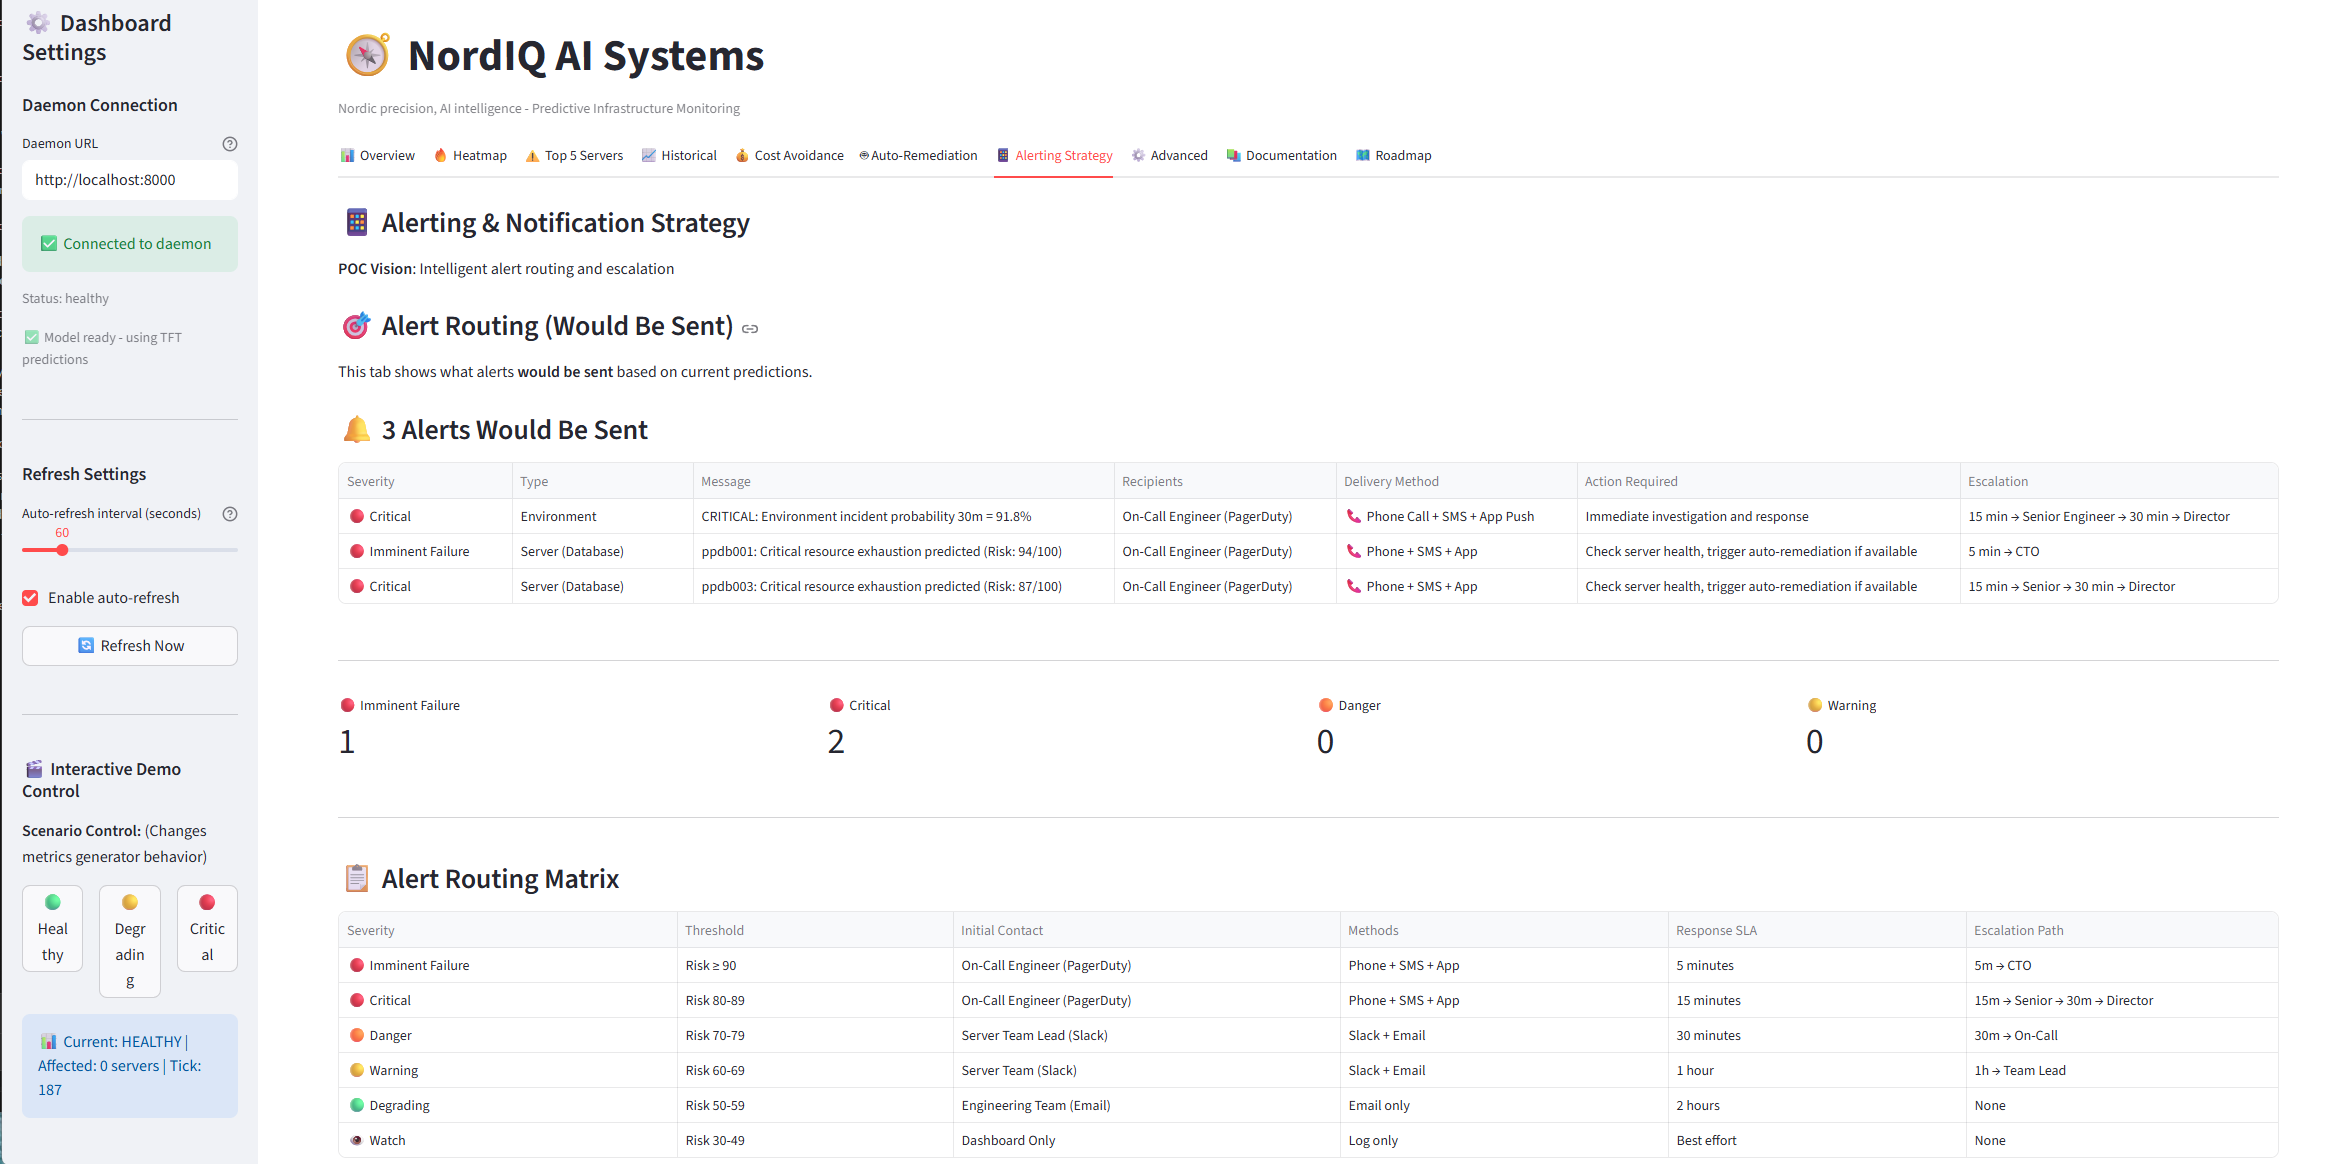
Alerting Strategy - 7 graduated severity levels
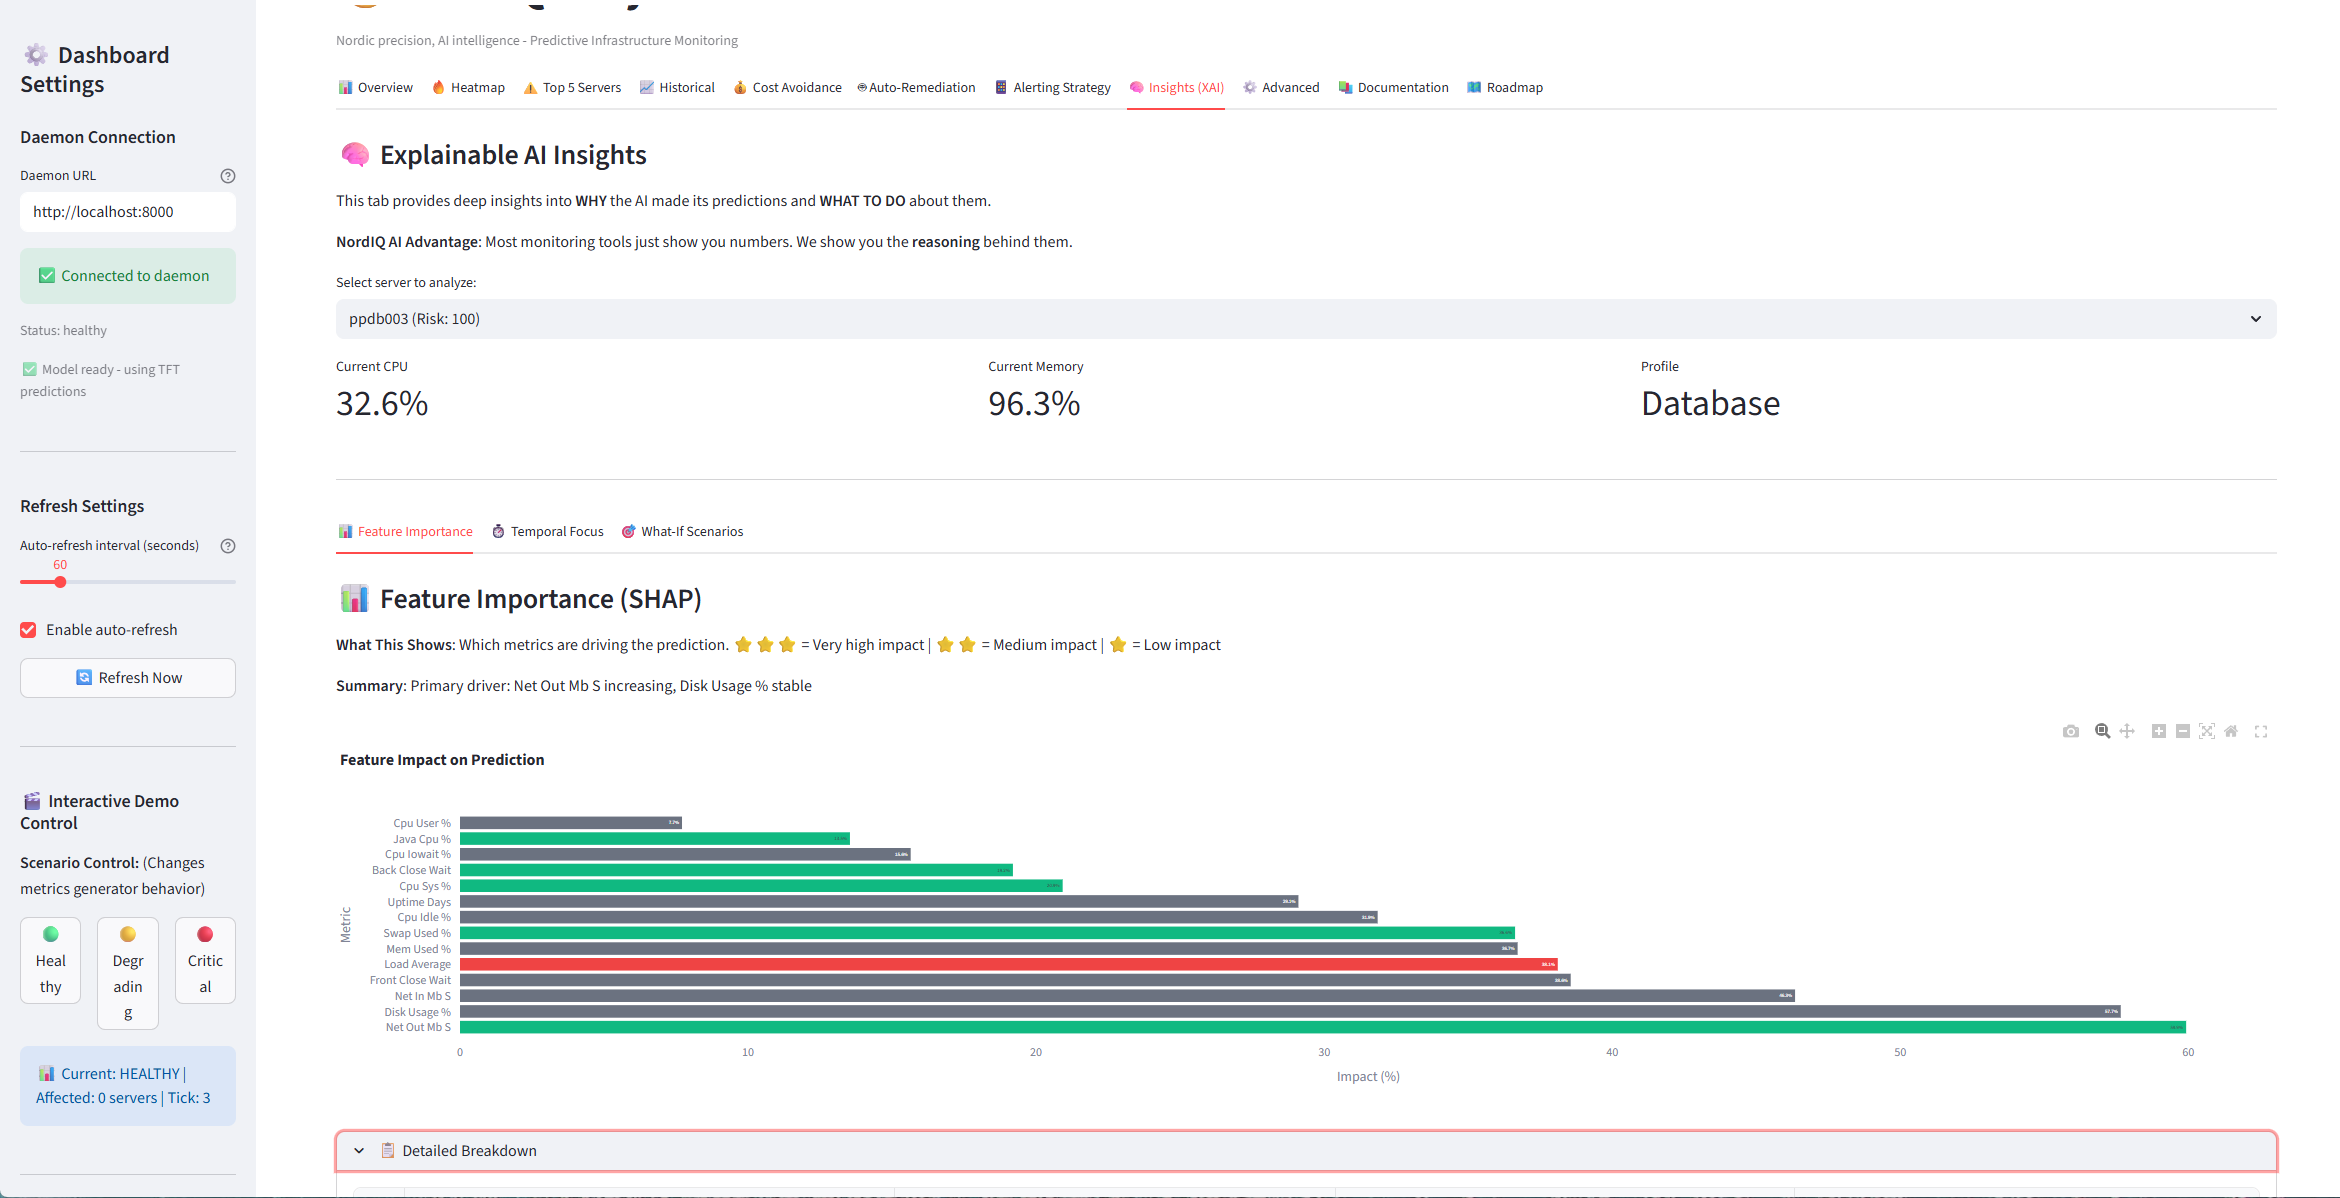
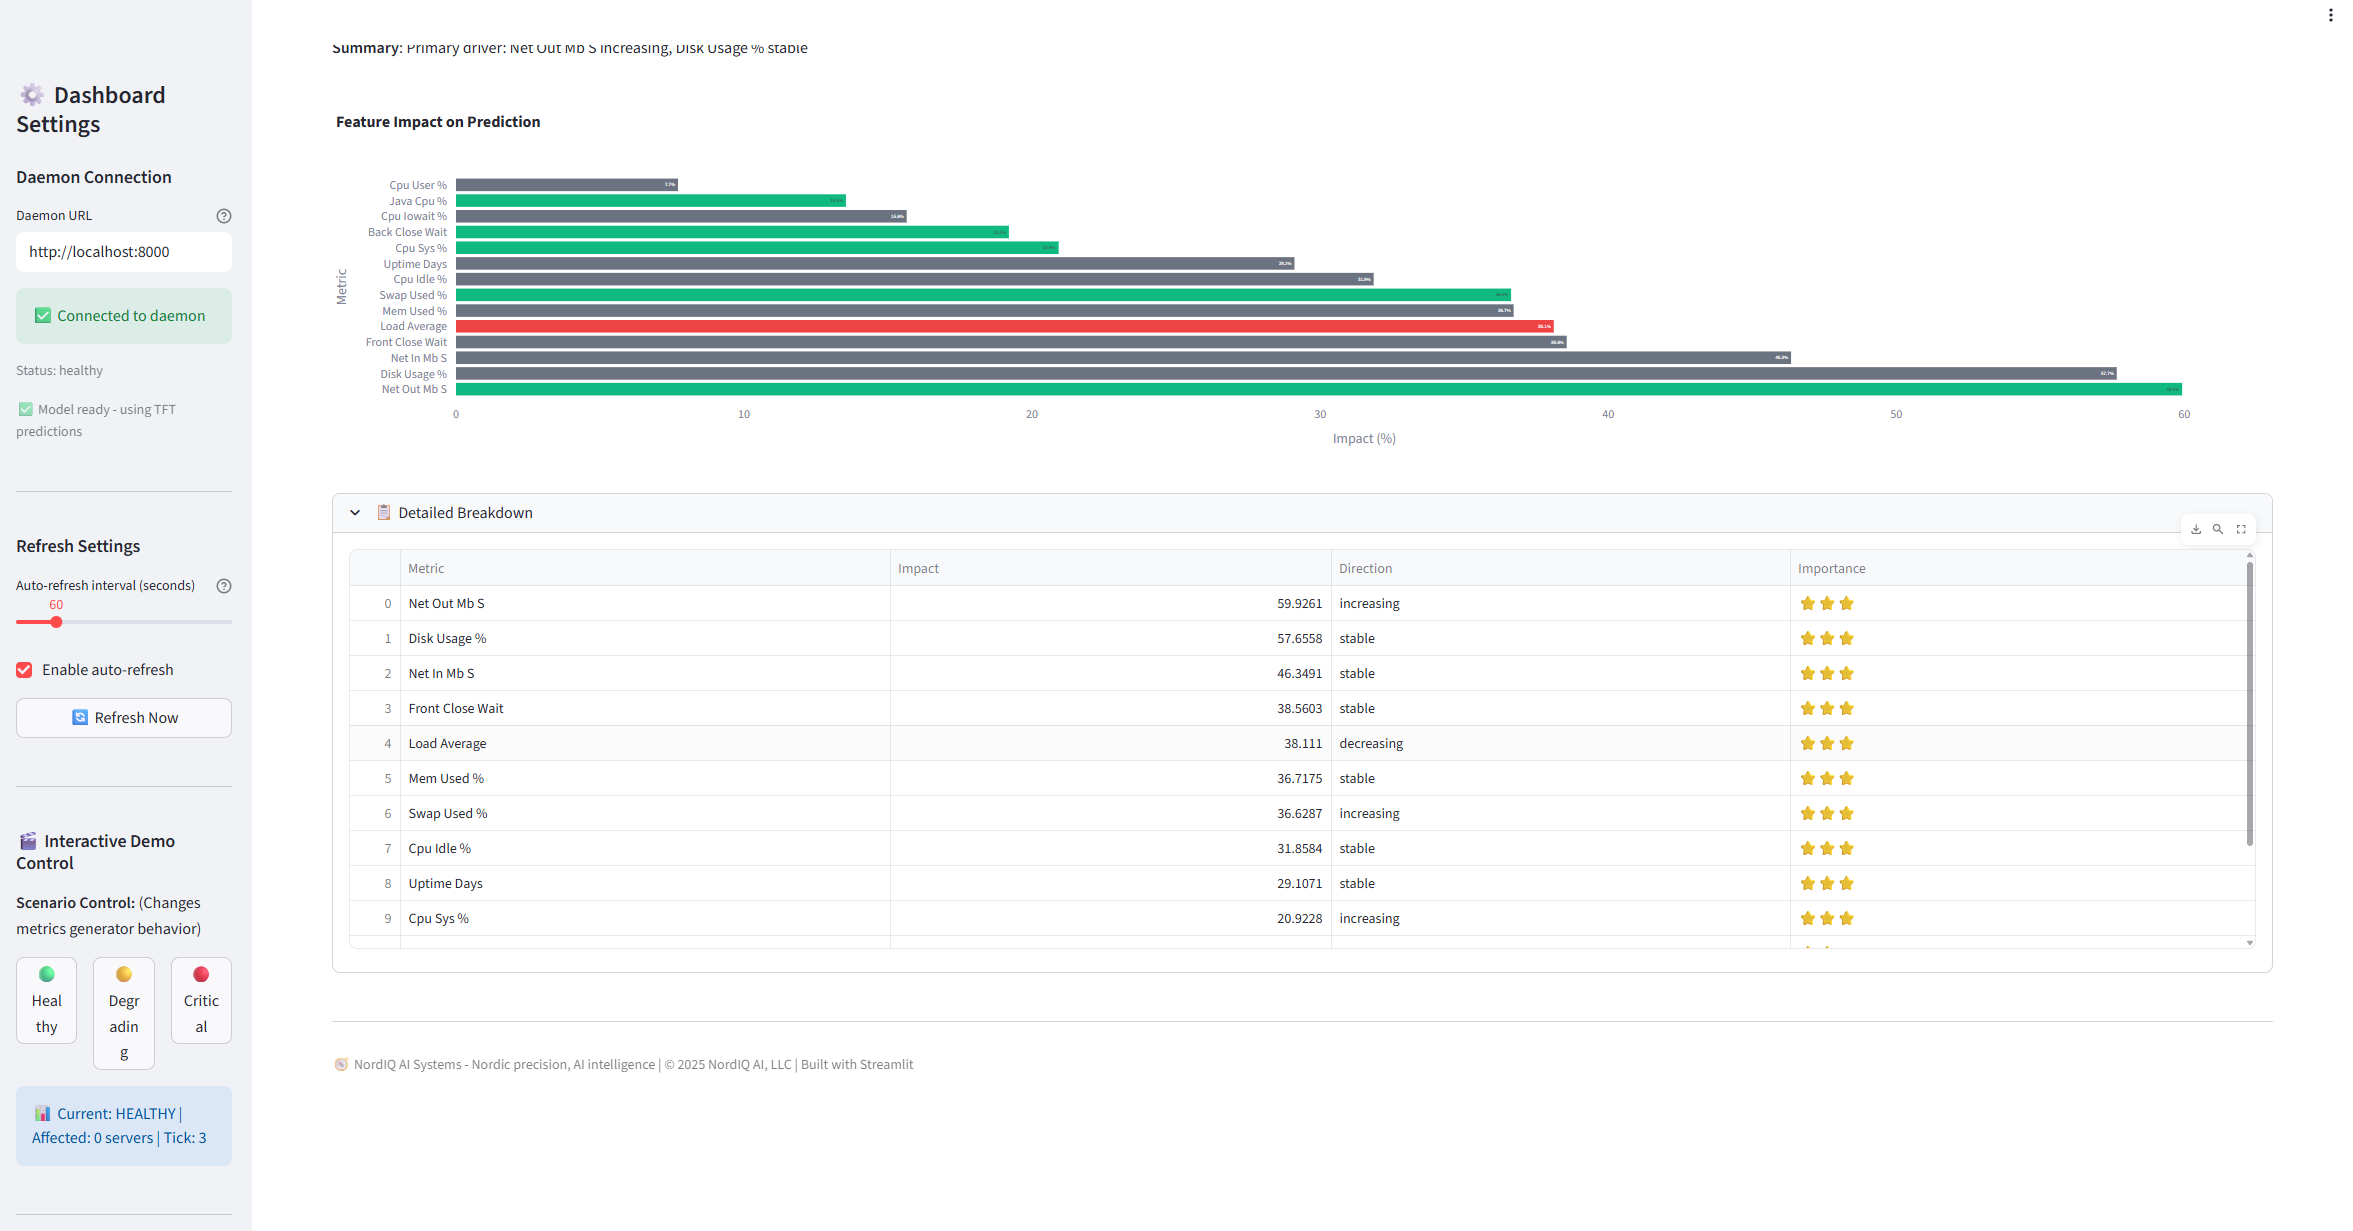
Advanced Analytics - Deep-dive into model performance
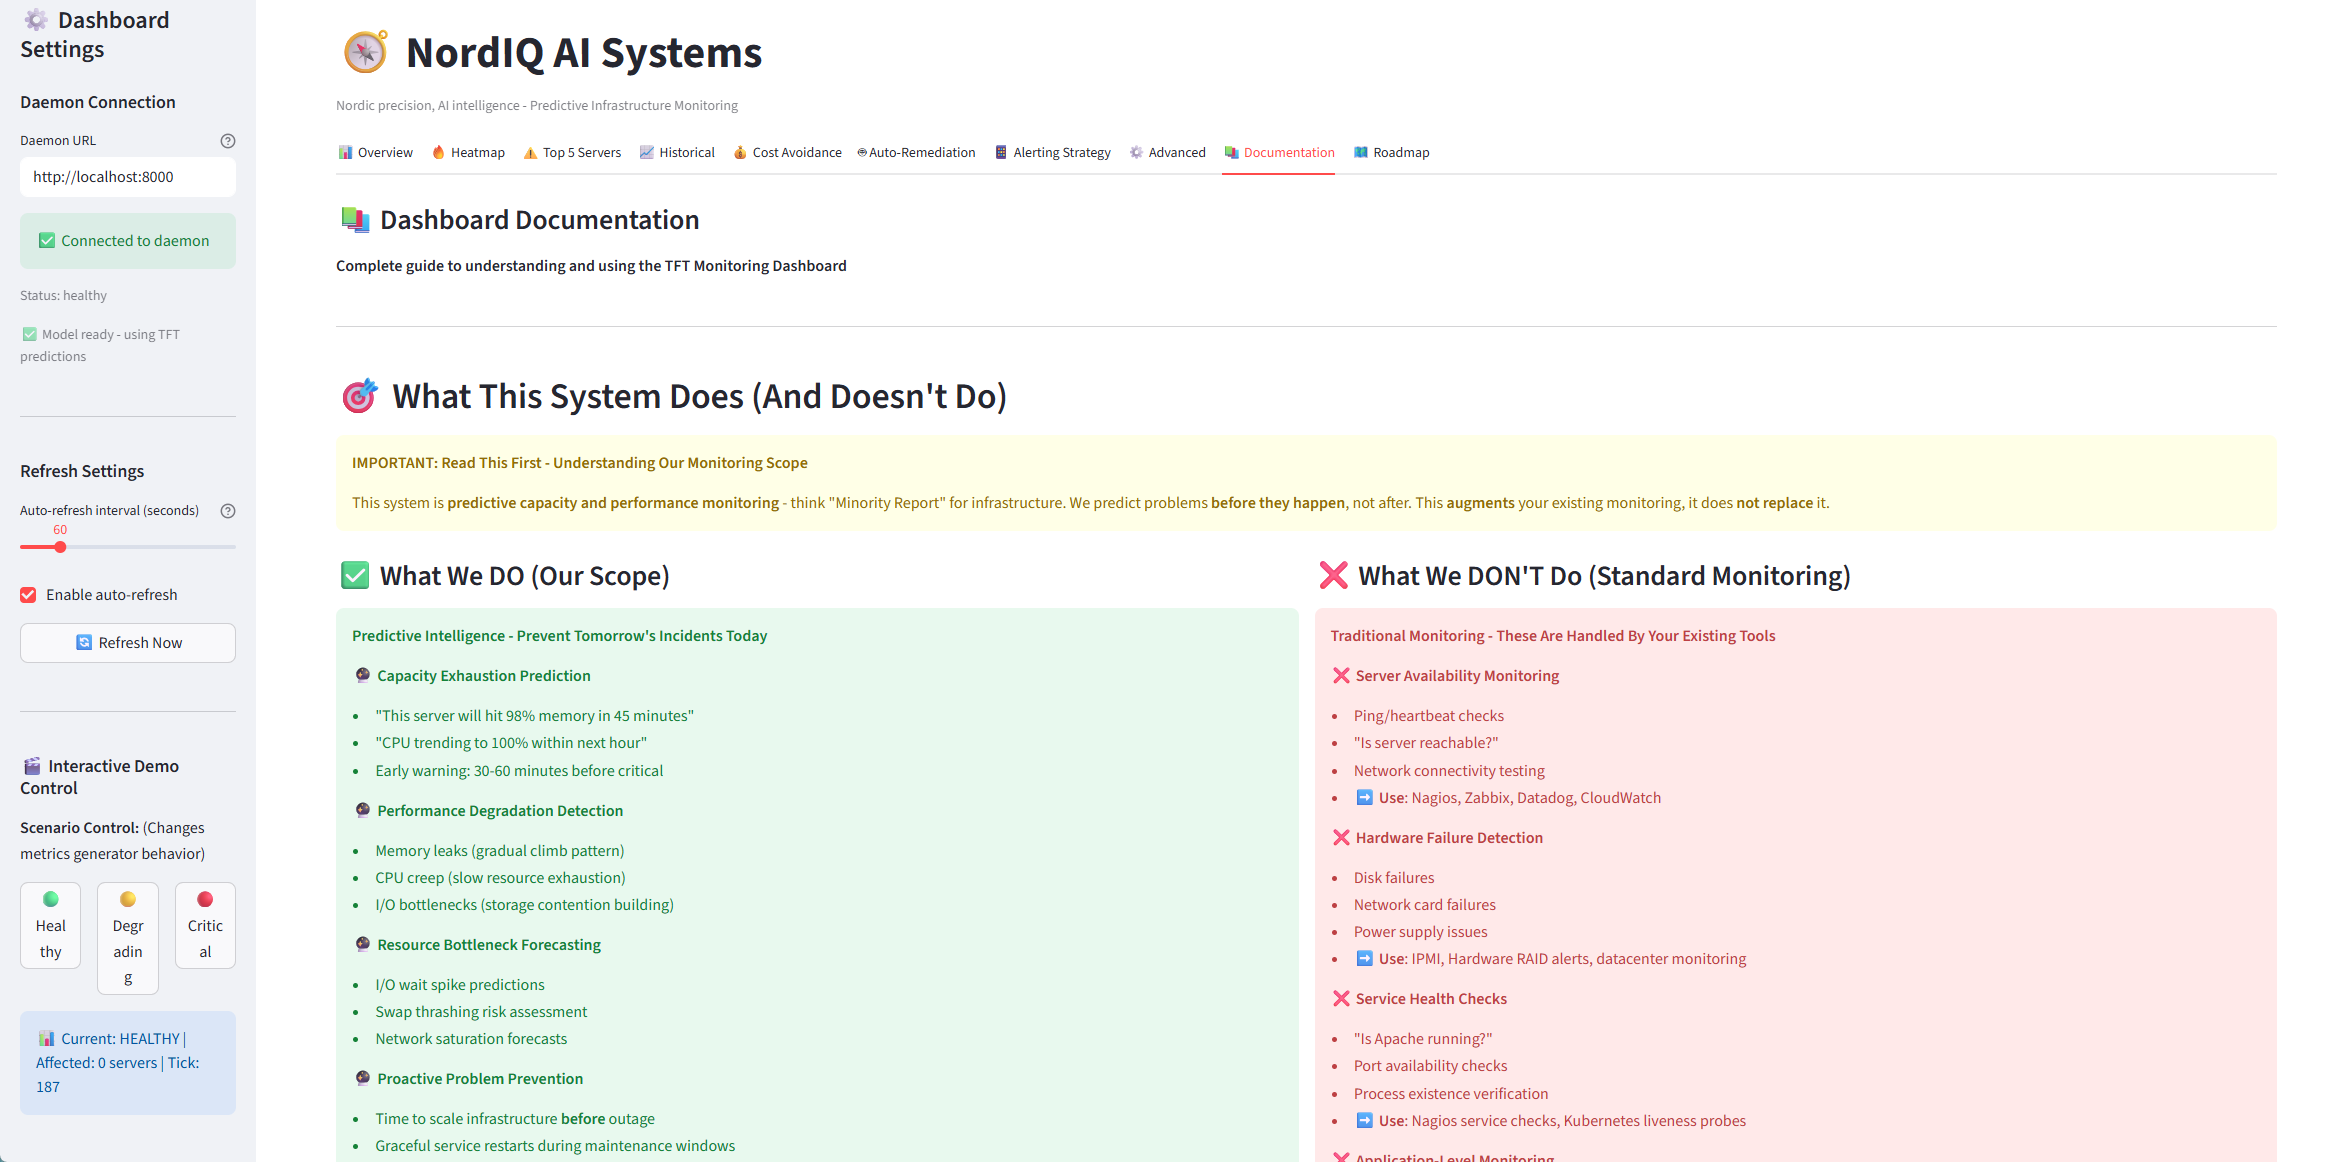
Built-in Documentation - What we DO vs DON'T do (crystal clear positioning)
Interactive Demo - Test different scenarios (healthy, degrading, critical)
Transparent Roadmap - See what's coming next